For more stories like this, sign up for the PLANSPONSOR NEWSDash daily newsletter.
Benefits September 27, 2022
Report Shows Different Spending Patterns by Retirement Plan Type
The research demonstrates that public-sector workers tend to feel safer spending more when they have a defined benefit retirement plan as their primary retirement account.
Reported by
Paul Mulholland

A new report by the Public Retirement Research Lab and J.P. Morgan Asset Management found that public-sector workers whose primary retirement account is a defined benefit plan tend to spend a higher ratio of their earnings than those with a defined contribution plan.
The PRRL is a collaboration between the Employee Benefit Research Institute and the National Association of Government Defined Contribution Administrators. They combined their datasets on public employees with DC, DB and hybrid plans with J.P. Morgan’s data on its customers’ income and savings collected by monitoring cash flows in and out of their J.P. Morgan accounts.
When they limited their combined data to household participants age 25 to 64 so they could focus on those of working age, they ended up with 36,690 households. Members of the households measured had to have a J.P. Morgan bank account to be included in the study, so if one member of a household had an account, but other members banked elsewhere, the total household size would be counted as one.
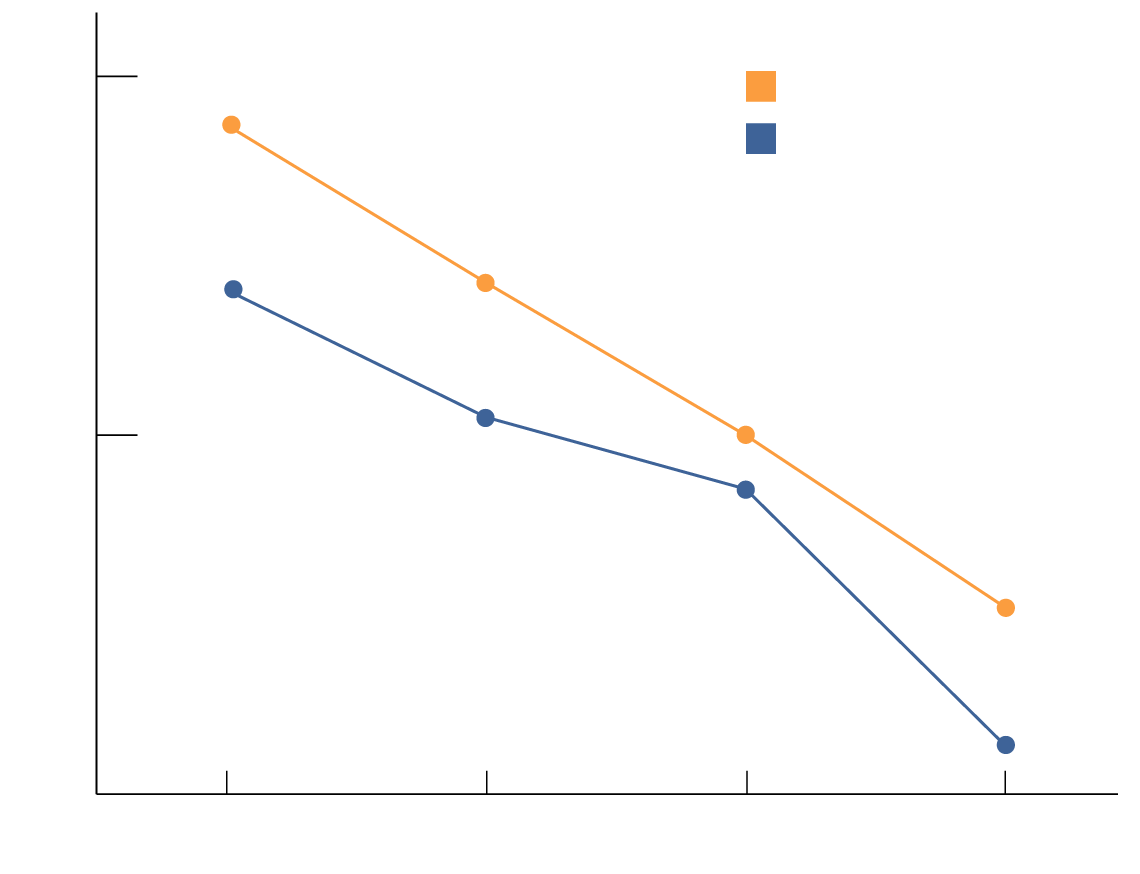
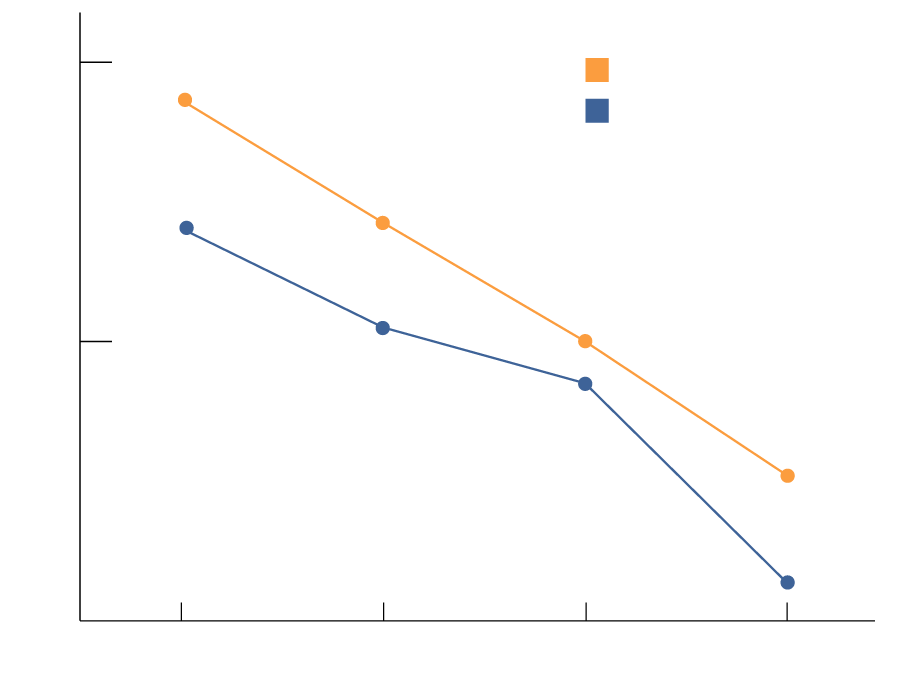
The study, written by Craig Copeland of EBRI, Kelly Hahn of J.P. Morgan Asset Management and Matt Petersen of NAGDCA, found that across all income quartiles, DB plan participants spend a higher ratio of their income than participants in DC or hybrid plans. At the lowest quartile, DB participants spent 117% of their income, versus 108% for non-DB participants, and at the highest quartile, DB participants spent 90%, versus 83% for non-DB participants.
Spending-to-Net-Income Ratio, by Income and Primary Defined Benefit (DB) Status
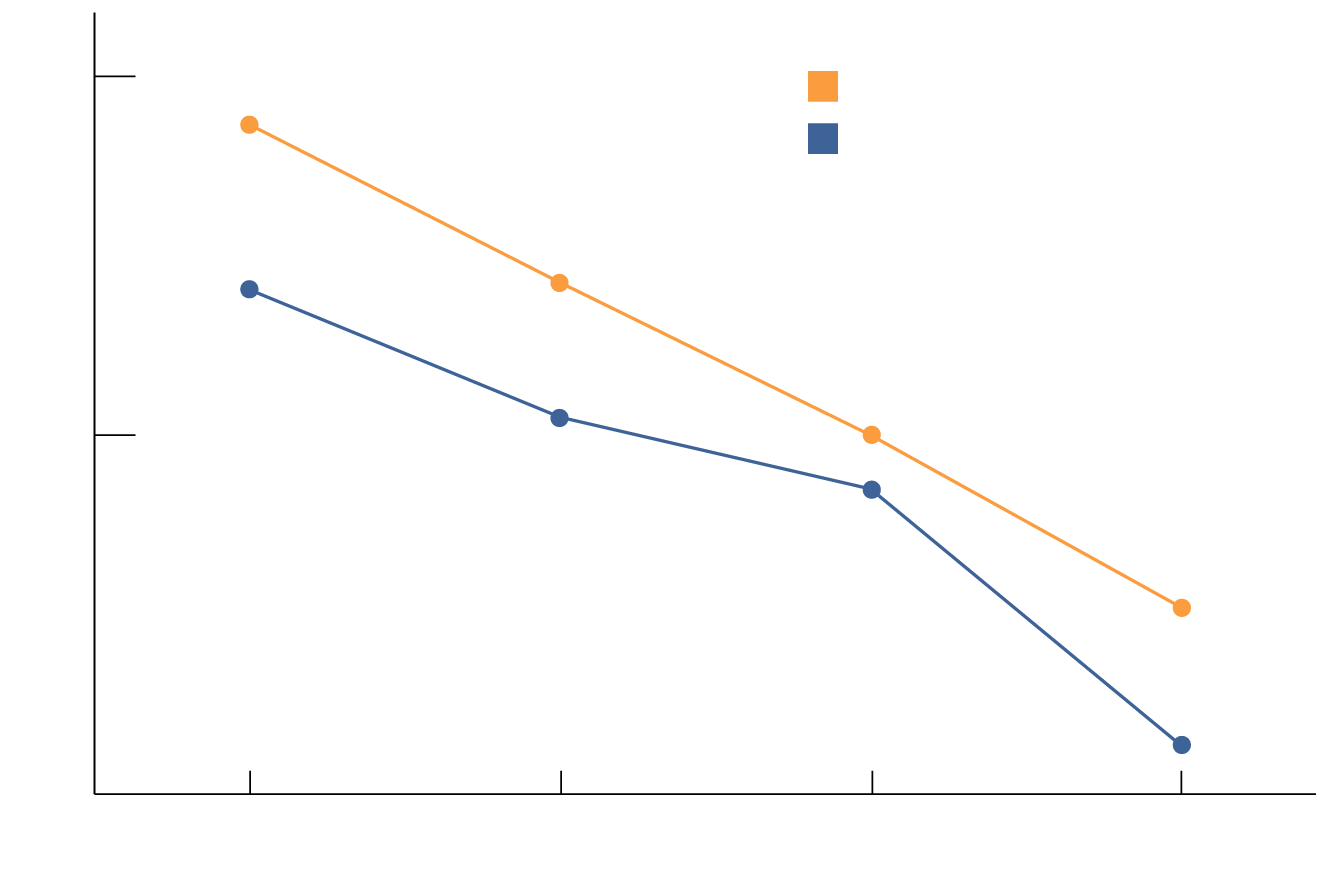
120
Primary DB
117.3%
Primary Non-DB
108.5%
108.1%
100.0%
100
101.0%
97.0%
90.4%
82.7%
80
Lowest Quartel
2nd Quartel
3rd Quartel
Highest Quartel
120
Primary DB
117.3%
Primary Non-DB
108.5%
108.1%
100.0%
100
101.0%
97.0%
90.4%
82.7%
80
Lowest Quartel
2nd Quartel
3rd Quartel
Highest Quartel
120
Primary DB
117.3%
Primary Non-DB
108.5%
108.1%
100.0%
100
101.0%
97.0%
90.4%
82.7%
80
Lowest Quartel
2nd Quartel
3rd Quartel
Highest Quartel
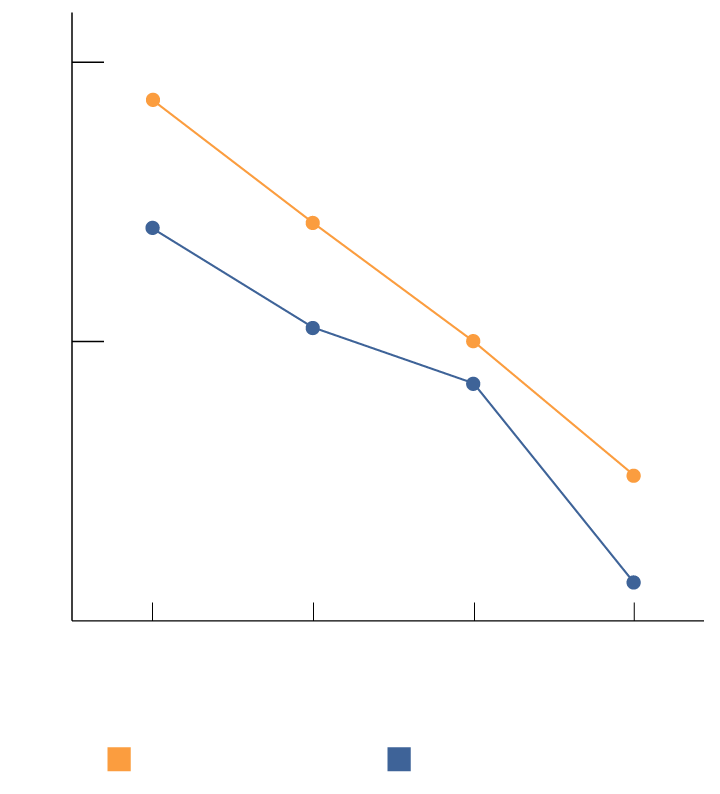
120
117.3%
108.1%
108.5%
100.0%
100
101.0%
97.0%
90.4%
82.7%
80
Lowest
Quartel
2nd
Quartel
3rd
Quartel
Highest
Quartel
Primary Non-DB
Primary DB
Source: PRRL Database and Select Chase Data
The authors speculated that this gap likely exists because workers with a DB plan have a retirement that is based on a formula, rather than market performance, and is perceived as lower risk. This reduced risk makes them feel more comfortable spending larger percentages of their total income.
The study found essentially no differences in the spending habits between the two categories concerning what they spent their money on. However, since spending data came from bank account usage, the researchers do not know what cash and checks were spent on.
Additionally, the study notes that some state and local government employers are exempt from Social Security if they offer a retirement plan that is at least as generous as Social Security itself. The researchers tested if Social Security coverage affected worker spending between the two categories, and found that it did not.
« Plan Progress Webinar: What to Expect From a Retirement Plan Adviser