Never miss a story — sign up for PLANSPONSOR newsletters to keep up on the latest retirement plan benefits news.
Data and Research May 13, 2020
Past Performance of DC Plan Participants Is Not Indicative of Future Results
Important differences suggest that a look at DC plan participant actions during the Great Recession may not offer insight into what they’ll do during this crisis.
Reported by
Rebecca Moore

No doubt many retirement plan industry stakeholders waited with bated breath to see what participants in defined contribution (DC) plans would do after the huge fall in the markets in March caused by the COVID-19 pandemic.
Initial reports from recordkeepers seemed to show that participants had learned the lessons repeatedly given to them to stay the course and take a long-term view when investing. However, the Alight Solutions 401(k) Index for March revealed participants traded at record-high levels. Total transfers as a percentage of the starting balance were the highest since October 2008. March had 18 above-normal days of trading activity—the most above-normal days in a month in the more than 20-year history of the 401(k) Index. Stable value funds took in 64% of the inflows and money market funds, 24%, according to the Index.
While the markets have been volatile, subsequent rallying resulted in a slower trading month in April. And, according to the Alight Solutions 401(k) Index for April, 12 of 21 trading days favored equity funds, and just nine favored fixed income.
As market crashes result in financial crises and affect employment and business trade, there are more ways participants may react, as past financial crises have shown. For example, they may decrease deferrals into their DC plans or stop participating altogether—either for financial reasons or because they lose their jobs.
According to PLANSPONSOR’s annual DC Survey, during the Great Recession, the aggregate plan participation rate slid from 73.8% in 2008 to a low of 69.7% in 2011 before rebounding to 72.6% in 2012.
DC Plan Participation Rate
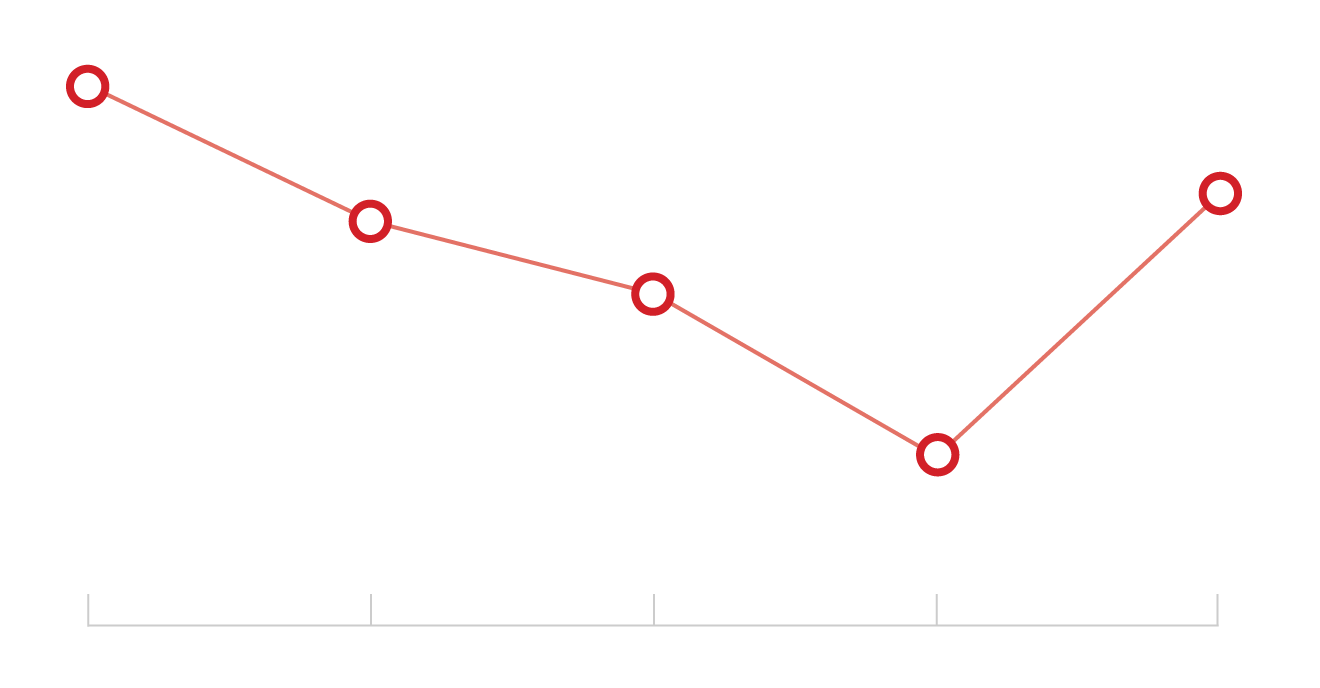
73.8%
72.6%
72.3%
71.5%
69.7%
2008
2009
2010
2011
2012

73.8%
72.6%
72.3%
71.5%
69.7%
2008
2009
2010
2011
2012
Source: 2019 DC Survey: Plan Benchmarking
Stacy Sandler, national leader for Deloitte’s retirement and wealth consulting practice in San Francisco, says, however, that every crisis is different. “And this one is unprecedented. I don’t believe past trends can be implicative of what’s occurring now,” she tells PLANSPONSOR.
One thing to note is that, as the participation rate trends show, during the Great Recession, it took some time for the effects of the financial crisis to reflect in DC plan participation. Sandler points out that looking at year-over-year data now shows an increase in the participation rate in DC plans; it is too soon to predict what will happen as a result of COVID-19. She says she sees similar trends in deferral rates year-over-year. In discussions with 17 CEOs of retirement plan service provider companies, Sandler has heard that some have seen participants lower savings rates but, overall, they haven’t seen large numbers.
One indication of participants lowering their deferral rates is the number who are deferring enough to get the full employer match. PLANSPONSOR’s DC Survey found the percentage of employers reporting that all or a vast majority of participants were deferring enough to get the full employer match increased from 57.2% in 2009 to 58.2% in 2010 before dropping to 49.8% in 2011. The question was not asked in the 2008 survey.
Vast Majority or All Participants Getting Full Employer Match

58.3%
57.2%
51.7%
49.8%
2009
2010
2011
2012

58.3%
57.2%
51.7%
49.8%
2009
2010
2011
2012
Source: 2019 DC Survey: Plan Benchmarking
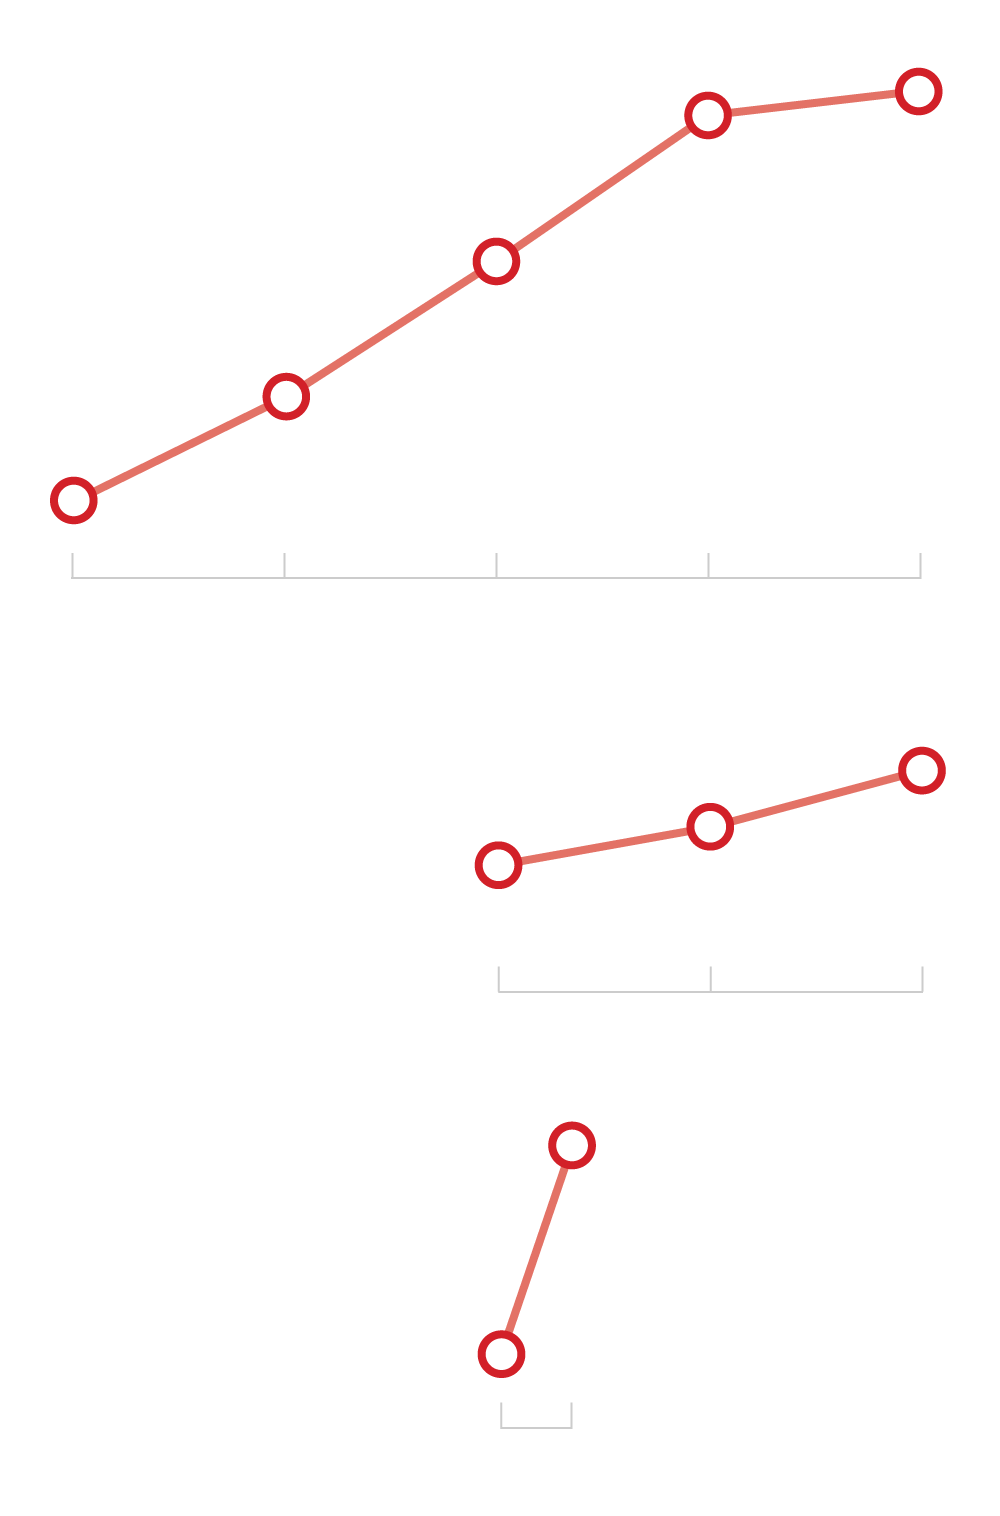
The rapidity with which the pandemic is affecting the economy may make one question whether DC plan participant reactions will occur more quickly than during past financial crises. Many events now are being compared with the Great Depression as well as the Great Recession, but a look at the effect on unemployment clearly shows a difference in timing.
The Great Depression started with the market crash in October 1929. While unemployment spiked each year—from a high of 3.2% in 1929 to a high of 8.7% in 1930 and 15.7% in 1931—it did not reach its highest level until 1933, at 24.9%. Likewise, according to The Balance, the Great Recession started with a market crash in September 2008 and the highest unemployment rate that year was 7.3%, but it wasn’t until 2009 that unemployment reached 9.9%. By comparison, just one month after the market crashed in March of this year because of the COVID-19 pandemic, unemployment reached 14.7%. That number is expected to grow, but with some businesses already starting to reopen, it will likely start trending downward.
Highest Unemployment Rate After Market Downturns

Great Depression
24.9%
23.6%
Market crashed October 1929
15.9%
8.7%
3.2%
1929
1930
1931
1932
1933
Great Recession
COVID-19
Market crashed September 2008
Market crashed March 2020
14.7%
9.9%
7.3%
5.0%
3.5%
2007
2008
2009
Dec
2019
Apr
2020
24.9%
Great Depression
23.6%
Market crashed October 1929
15.9%
8.7%
3.2%
1929
1930
1931
1932
1933
9.9%
7.3%
5.0%
Great Recession
Market crashed September 2008
2007
2008
2009
14.7%
COVID-19
Market crashed March 2020
3.5%
Dec
2019
Apr
2020

24.9%
Great Depression
23.6%
Market crashed October 1929
15.9%
8.7%
3.2%
1929
1930
1931
1932
1933
9.9%
7.3%
5.0%
Great Recession
Market crashed September 2008
2007
2008
2009
14.7%
COVID-19
Market crashed March 2020
3.5%
Dec 2019
Apr 2020
Source: The Balance
Sandler points out that businesses are not just laying off or terminating employees but many are furloughing employees—meaning they will come back to their jobs at some time. “Some firms will be starting as early as mid-May to bring people back, and one is saying success for them could be 40% of the workforce back in the office by late August,” she says.
Sandler adds that the financial effect on employees also depends on whether employers can maintain benefits for employees who are furloughed. Some are still providing benefits. In addition, certain industries—such as airlines and hospitality—have been hit harder than others and will be affected longer than others.
Another difference between the current financial crisis and the Great Recession is that after President Donald Trump declared the pandemic to be a federal emergency, Congress passed legislation that allowed retirement plan participants to get a special coronavirus-related distribution (CRD) from their plans, as well as increased the limit on the amount of loans participants could take. Legislation or not, withdrawals and loans are another way DC plan participants may react when a financial crisis affects them.
PLANSPONSOR’s DC Survey shows that during the Great Recession, the aggregate number of participants with outstanding loans jumped from 12.8% in 2010 to 16.2% in 2011 before decreasing again to 14.2% in 2012.
Participants With Outstanding Loans
16.2%
14.2%
12.8%
12.1%
12.3%
2008
2009
2010
2011
2012

16.2%
12.1%
12.3%
14.2%
12.8%
2008
2009
2010
2011
2012
Source: 2019 DC Survey: Plan Benchmarking
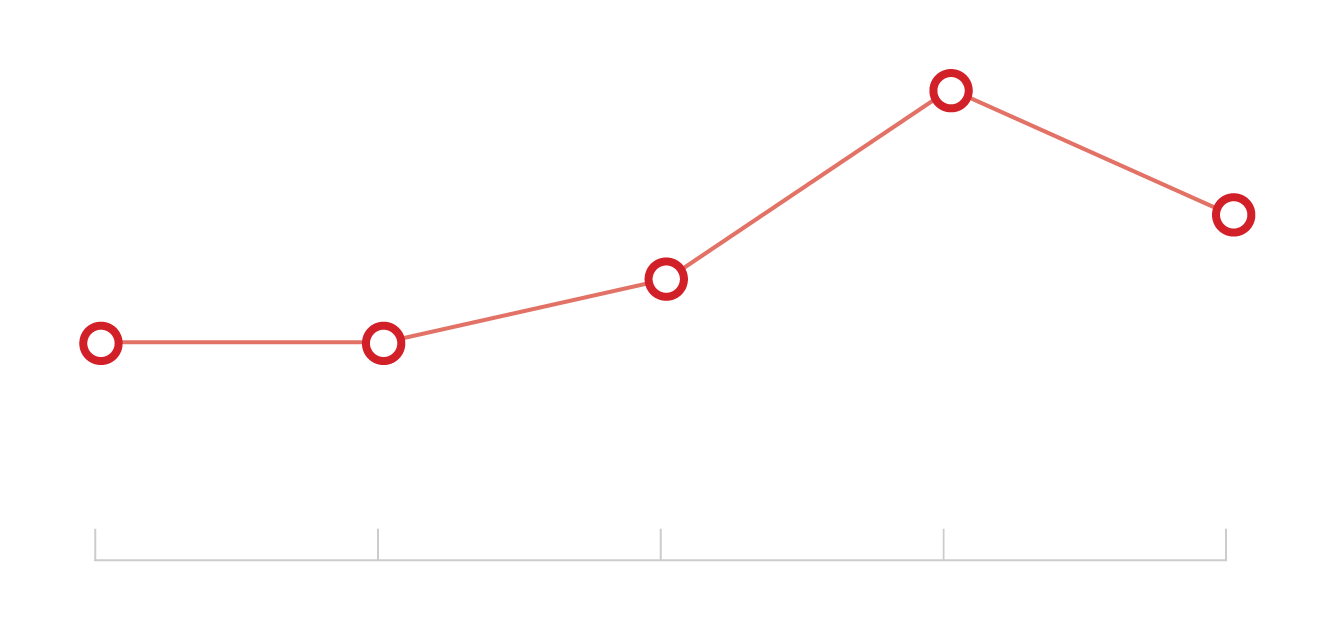
While the percentage of participants who took a hardship withdrawal decreased from 2.7% in 2009 to 2.1% in 2010, it also jumped to 3.6% in 2011 before falling to 2% in 2012.
Participants Who Took Hardship Withdrawals

3.6%
2.7%
2.1%
2.0%
2009
2010
2011
2012

3.6%
2.7%
2.0%
2.1%
2009
2010
2011
2012
Source: 2019 DC Survey: Plan Benchmarking
In her conversations with retirement plan provider CEOs, Sandler has heard that fewer loans have been taken than withdrawals and that some providers have seen more in-service withdrawals than hardship withdrawals. While the number of hardship withdrawals taken may have risen, the total amount is still small, she says.
She points out, though, that many DC plan sponsors have still not decided whether they will allow for coronavirus-related distributions and/or increased loan limits. Most providers are using an opt-in approach to the Coronavirus Aid, Relief and Economic Security (CARES) Act provisions and have so far seen a 20% to 40% adoption rate by plan sponsors, Sandler says. She adds that some providers noted the adoption rate is higher as plan assets increase and is also higher in some industries, such as hotels.
After the market crashed, providers ramped up staff and increased hours for their call centers, expecting a tremendous amount of calls from DC plan participants, Sandler says. “Call center activity has been all over the board and, again, has depended on industry for the most part,” she says. However, some providers are reporting that there are not necessarily more calls, but the calls that do come are twice as long. “Participants don’t know what they can and cannot do,” Sandler says.
She adds that there have been more participant calls to financial advisers. And one provider has changed its call tree to ask participants if they want to speak with an adviser before making a deferral or investment change or requesting a loan or distribution.
It’s hard to predict what actions DC plan participants may take and when during this financial crisis. “Everything is changing day to day,” Sandler says. “From day one that we’ve been talking to [plan providers] to today, things are evolving.”
« New ERISA Excessive Fee Complaint Targets Aegis Fiduciaries