2020
Recordkeeping Survey

Industry Snapshot
403(b) Plans
The 403(b) market had crossed $1 trillion in assets at year-end last year, a notable accomplishment if not for the $6 trillion shadow cast by 401(k) plans. However, the functional difference between these two plan types has started to blur in recent years as 403(b) sponsors, spurred by regulatory changes, have more fully embraced their role as fiduciaries.
For example, many 403(b) plans used the recent remedial amendment period to improve their plan document(s), which helped simplify oversight of the multi-vendor arrangements that have been common in the industry. However, over the past decade, the number of 403(b) plans that follow requirements set forth by the Employee Retirement Income Security Act (ERISA) has remained unchanged, hovering around 25%.
Collectively, 403(b) plans cover over 15 million workers in specialized industries such as education, hospitals, churches or religious organizations, and other nonprofit entities. The differing needs of these industries and the varying size of average participant account balances—e.g., those in higher education are twice those in K – 12 schools—have resulted in a range of service models catering to each sub-segment. Additionally, both local and national tax support is common for public worker plans.
Recordkeeping for 403(b) plan assets is more heavily concentrated with a few providers than it is for 401(k) plans. The Top 5 403(b) providers account for 83% of all 403(b) assets; the Top 5 401(k) providers account for 63% of all 401(k) assets. —BOK
Total 403(b) Assets, Plans and Participants
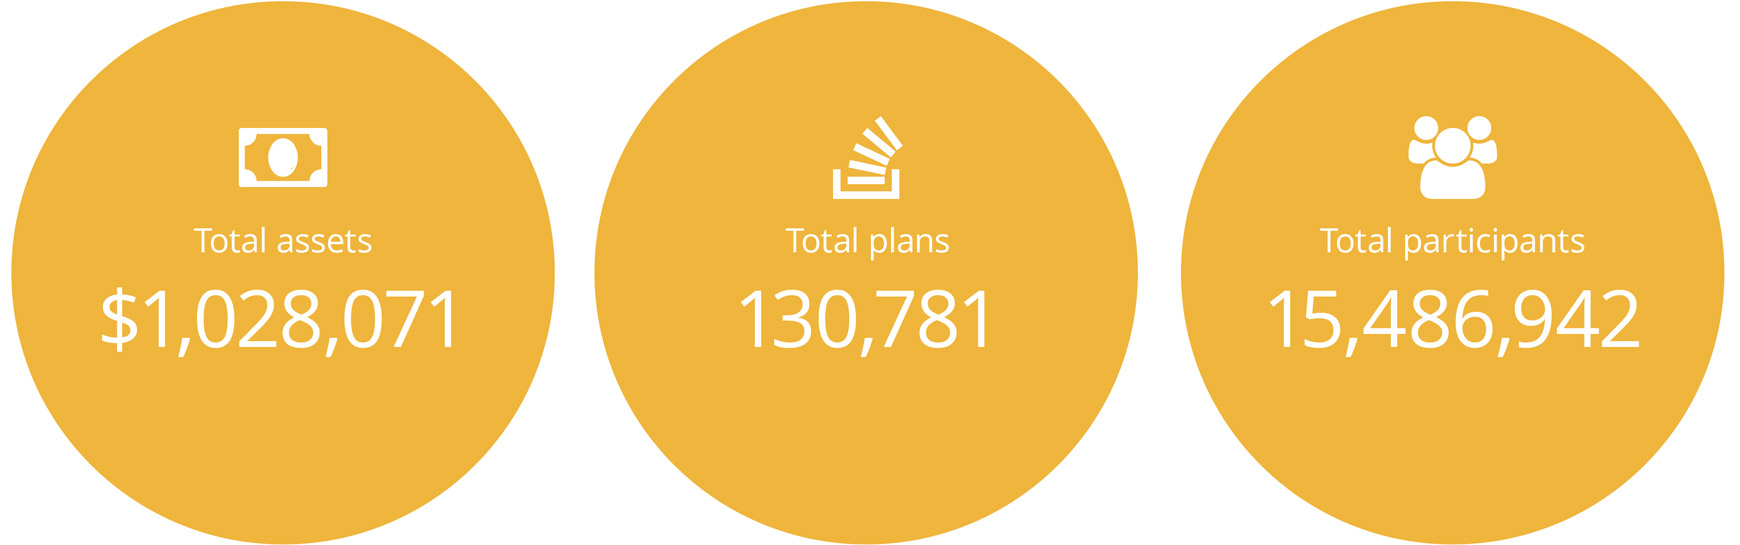
| Plan Size | Assets ($mm)* | Plans* | Participants* |
|---|---|---|---|
| <$10mm | $93,990 | 122,190 |
3,024,457 |
| $10mm – $50mm | $117,236 | 6,543 | 2,609,847 |
| >$50mm – $200mm | $156,089 | 1,703 |
2,452,698 |
| >$200mm | $660,756 | 345 | 7,399,940 |
| *Not all providers report complete data; therefore, data segmented by plan size will not equal the corresponding overall total. | |||