

Get more! Sign up for PLANSPONSOR newsletters.
Thought Leadership November 2, 2021
How to Keep Participants Invested
It’s important to think about the effect volatility has on target-date funds.
Sponsored by
PIMCO
|
|
 |
 |
| Erin Browne Portfolio Manager, Multi-Asset Strategies |
Bransby Whitton Product Strategist |
Georgi Popov Product Strategist |
Shawn Coffman Product Strategist |
The ability to “set it and forget it” has long made target date funds (TDFs) an appealing investment for defined contribution (DC) participants. They can leave it to investment professionals to manage allocations and dial down risk as retirement nears.
Yet 2020 highlighted another type of risk to TDF investors – the risk that severe volatility could prompt rash selling that crystallizes losses. Such was the case last March when the spreading COVID-19 pandemic spooked markets. The 12% plunge on March 16 was the third-biggest percentage loss ever for the S&P 500 Index, eclipsed only by Black Monday in October 1987 and October 1929 near the start of the Great Depression.
March 2020 reminded us that financial markets can do the seemingly impossible. Based on a normal distribution of returns, historical data suggests a single-day decline of 12% in the equity market should almost never happen – yet it did on 16 March. That’s why factoring in these extremely rare events is imperative when selecting the qualified default investment alternative (QDIA) option – typically a TDF – for those nearest to, or in, retirement. Figure 1 illustrates why this is so critical for participants, especially those with the most to lose. In the first quarter of 2020 alone, net outflows from TDFs in retirement or within five years from retirement totaled $11.9 billion, almost 15 times greater than the 2018 quarterly average, and in sharp contrast to the net inflows seen in 2019.
Importantly, some participants were slow to re-enter the market. They missed out on a remarkable recovery, effectively “crystallizing” their losses.
Figure 1: Individuals closest to retirement withdrew the most

For participants about to retire, cashing out or trying to time the markets can have disastrous results. Figure 2 shows three hypothetical participants, all of whom had planned to retire at the end of 2020. As you can see, participant 1, who stayed invested, gained 11% during the period, whereas the other two participants – even the one who re-entered the market – retired with a loss during 2020.
Figure 2: Rash selling can be costly

While the markets cannot be controlled, advisors and sponsors can help guide participant behavior in times of uncertainty and volatility. Here are two ideas to help keep participants invested amid challenging market environments:
1. Diversification remains the first line of defense
Dissecting the level and type of risks along the entire glide path is essential to understanding the degree to which a glide path is diversified. Early on, when equity allocations are highest, equity exposures are calibrated by market capitalization (e.g., small cap), geography (e.g., U.S., non-U.S. and emerging markets) and by the degree of equity-like substitutes (e.g., high yield bonds, real estate investment trusts, etc.). In our view, the glide path allocation among risk-seeking assets should be focused on maximizing returns per unit of risk. While this emphasis should persist throughout the glide path, it is most critical for younger participants who are most heavily invested in risk-seeking assets. The relative performance of TDFs during the 2020 drawdown showed that advisors and sponsors should pay special attention to so-called “through” glide paths for older age cohorts given the meaningfully higher equity allocations at retirement relative to “to” providers.
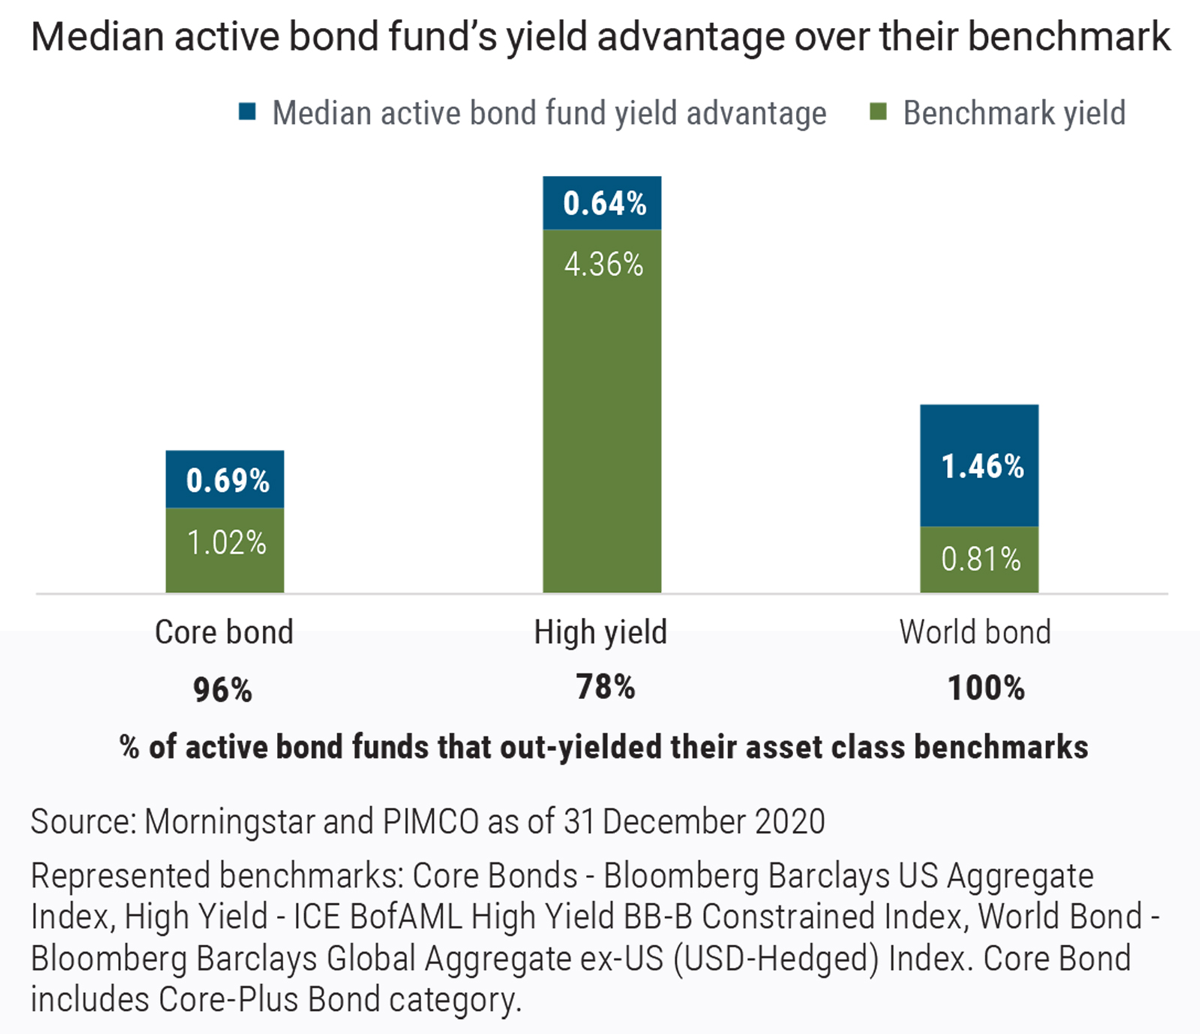
Turning to fixed income, the most common allocation in most glide paths is core bonds, or Bloomberg Barclays US Aggregate Bond Index (Agg) exposure. While glide paths may use other fixed income allocations such as Treasury Inflation-Protected Securities (TIPS) and high yield bonds, these allocations are typically so small that the average glide path yield essentially equals that of the Agg at 1%.1 Given that starting yields tend to be an accurate forecast of long-term expected returns, broadening fixed income diversification should not only help improve estimated risk-adjusted returns (Sharpe ratios), but also estimated returns, assuming such diversifiers can enhance the overall fixed income yield. For example, high yield currently offers roughly 3.3 percentage points of additional yield to core bonds (see Figure 3). We estimate well-diversified fixed income allocations in glide paths can enhance the yield of core bonds by anywhere from 0.5 to 1 percentage point in the current market environment. This added yield enhances estimated returns from fixed income and should further support improved participant outcomes.
2. Active management can help cushion volatility and enhance risk management
Figure 3: Active bond managers have out-yielded their passive peers
Over a typical 40-year accumulation phase, a 1 percentage point boost to annual returns from the fixed income portion of a glide path can raise a participant’s balance at age 65 by $39,000 (a 7% improvement), resulting in seven additional years of expected retirement income.2
Ultimately, advisors and sponsors want to optimize participants’ fee dollars to active opportunities where enhanced returns are most likely to be achieved. We think a blend of active bonds and passive equities gives the best of both worlds, and this trend continues to gain momentum.
In response to the pandemic, yields across the globe have reached new lows. This creates a major headwind for income generation in DC plans. Fortunately, the track record of active managers out-yielding their respective benchmarks is strong and consistent. Figure 3 illustrates that for the top three bond categories in DC, roughly 90% of active bond managers meaningfully beat their benchmarks in yield3 (represented by the blue portion of bars). Broadening the fixed income investment universe and employing active management may lead to a meaningful boost in income generation, and a greater number of participants achieving a successful retirement.
Click here to read the full article.
1 As of 31 December 2020.
2 Hypothetical example based on the industry average glide path, as provided by Morningstar as of 31 December 2019, which represents latest available from the source. Salary and contribution assumptions are based on Employee Benefit Research Institute (EBRI) data. Return assumptions based on PIMCO’s supersecular capital market assumptions. Calculated real ending account balance at retirement is $538,000, as of 31 December 2020.
3 As of 31 December 2020.
Sponsored by
